This page contains extensive information and facts about gun and gun violence both in the United States and specifically in Minnesota.
Table of Contents
American Gun Deaths and Injuries
Per Year | Per Day | |
|---|---|---|
Total number of non-suicide incidents | 56,931 | 156 |
Approx. number of gun suicides (2017) | 24,000 | 66 |
Total Shooting Incidents | 80,931 | 222 |
Number non-suicides deaths | 14,637 | 40 |
Approx. number of gun suicides (2017) | 24,000 | 66 |
Total gun deaths | 38,637 | 106 |
Number of gun injuries | 42,294 | 116 |
Number of children killed or injured (0-11) | 666 | 2 |
Number of teens killed or injured (12-17) | 2,830 | 8 |
Total children and teens shot | 3,496 | 10 |
Mass shootings | 340 | |
Police officer shot or killed | 291 | |
Police shootings of suspects | 2,139 | |
Home invasion | 2,056 | |
Defensive use | 1,773 | |
Unintentional shooting | 1,604 |
Source: Gun Violence Archive, validated January 12, 2019.
44% of US adults say they personally know someone who has been shot, either accidentally or intentionally. 23% say they or someone in their family have been threatened or intimidated by someone using a gun. Half see gun violence as a very big problem in the U.S. today.
Source: Pew Research Center, “America’s Complex Relationship With Guns: An in-depth look at the attitudes and experiences of U.S. adults.” By Kim Parker, Juliana Menasce Horowitz, Ruth Igielnik, Baxter Oliphant, and Anna Brown. June 22, 2017.
American Views on Guns
- According to a February 2018 poll by Quinnipiac University
- American voters support stricter gun laws 66 – 31 percent, the highest level of support ever measured by the independent Quinnipiac University National Poll,
- 50 – 44 percent support among gun owners,
- 62 – 35 percent support from white voters with no college degree,
- 58 – 38 percent support among white men.
- Support for universal background checks is almost universal, 97 – 2 percent, including 97 – 3 percent among gun owners. Support for gun control on other questions is at its highest level since the Quinnipiac University Poll began focusing on this issue in the wake of the Sandy Hook massacre:
- 67 – 29 percent for a nationwide ban on the sale of assault weapons;
- 83 – 14 percent for a mandatory waiting period for all gun purchases.
- It is too easy to buy a gun in the U.S. today, American voters say 67 – 3 percent.
- If more people carried guns, the U.S. would be less safe, voters say 59 – 33 percent.
- Congress needs to do more to reduce gun violence, voters say 75 – 17 percent.
- Stricter gun control would do more to reduce gun violence in schools, 40 percent of voters say, while 34 percent say metal detectors would do more and 20 percent say armed teachers are the answer.
- Mass killings by U.S. citizens is a bigger problem than mass killings by people from other countries, American voters say 70 – 20 percent.
- Source: Quinnipiac University Poll, February 20, 2018.
Assault Weapons
- The weapons were banned in 1994 under the federal assault weapons ban but were reintroduced to the public marketplace in 2004.
- “The Assault weapons bans reduced the number of school shooting victims by 54.4 percent.” Mark Gius of Quinnipiac University writes in the journal Applied Economics Letters.
- Source: PS Mag, 2017
- Researchers and trade groups estimate that there are as many as 20 million assault-style rifles in the country, with more than a million made each year.
- Source: “Minnesota Poll: Support remains high for universal background checks,” by Stephen Montemayor, Star Tribune, October 22, 2019.
- Active shooters with semi-automatic rifles wound and kill twice as many people as those using weapons that don’t self-load, although chances of dying if hit in either type of assault are the same.
- Source: Lethality of Civilian Active Shooter Incidents With and Without Semiautomatic Rifles in the United States; Elzerie de Jager, MBBS(Hons)1; Eric Goralnick, MD, MS2; Justin C. McCarty, DO1; et al. JAMA 2018.
- 135% people more were shot and 57% more people were killed in mass shootings when assault-style weapons or largecapacity ammunition magazines were used, compared to other mass shootings.
- Source: For some of the mass shootings included in the analysis, information about the types of firearms and ammunition magazines used remains unknown. Mayors Against Illegal Guns, Analysis of Recent Mass Shootings (Jan. 2013).
- Compared with the 10-year period before the ban, the number of gun massacres during the ban period fell by 37 percent, and the number of people dying from gun massacres fell by 43 percent. But after the ban lapsed in 2004, the numbers shot up again — an astonishing 183 percent increase in massacres and a 239 percent increase in massacre deaths.
- Source: Rampage Nation, by Louis Klarevas, University of Massachusetts, as reported in “It’s time to bring back the assault weapons ban, gun violence experts say,” by Christopher Ingraham, The Washington Post, February 15, 2018.
- A February 2018 poll by Quinnipiac University found that Americans favor a nationwide ban on the sale of assault weapons 67 – 29 percent.
- Source: Quinnipiac University Poll, February 20, 2018.
- In a 2003 survey, 67% of Field & Stream readers polled did not consider assault weapons to be legitimate sporting guns.
- Source: Field & Stream, The 2003 National Hunting Survey, July 2003 (citing an informal survey of 2,897 readers).
Background Checks – Effectiveness of and Support For
- Since the federal background check requirement was adopted in 1994, over 3 million people legally prohibited from possessing a gun have been stopped from purchasing a gun or denied a permit to purchase. More than 35% of these denials involved people convicted of felony offenses.
- Source: Jennifer Karberg, et al., “Background Checks for Firearm Transfers, 2015—Statistical Tables,” US Department of Justice: Bureau of Justice Statistics (2017).
- Individuals who commit crimes with firearms may intentionally seek to purchase guns from sellers who aren’t required to run background checks. Purchasers from Armslist.com, a major online firearms marketplace, were nearly seven times as likely to have a firearm-prohibiting criminal record than people attempting to buy guns from licensed dealers.
- Source: “Unchecked,” Everytown for Gun Safety, February2019.
- Current Minnesota law does not require unlicensed sellers to run criminal background checks before gun sales.
- Source: Minn. Stat. § 624.7132, subd. 12(1).
In the states that require a background check before every handgun sale, there are,
- 48% fewer suicides by gun,
- 46% fewer women shot to death by their domestic partners,
- 48% fewer police officers who die by hand gun fire.
- 48% fewer incidents of trafficking, and
- 52% fewer mass shootings.
- Source: Everytown.
- Suicide: Throughout the study period of 2008-12, 14 states and the District of Columbia required all gun buyers to undergo a background check before buying a handgun in an unlicensed sale, and 36 states did not. Since then, Colorado, Delaware, and Washington adopted these laws as well. Suicide data were obtained from the CDC’s Fatal Injury Reports on December 2, 2014.
- Source: Everytown.
- Domestic Violence: Throughout the study period of 2008-12, 14 states and the District of Columbia required all gun buyers to undergo background checks before buying handguns in unlicensed sales, and 36 states did not. Since then, Colorado, Delaware, and Washington adopted these background checks laws.
- Source: Everytown.
- Law Enforcement: Throughout the study period of 2000-11, 13 states required all gun buyers to undergo a background check before buying a handgun in an unlicensed sale, and 36 states did not. Missouri repealed its background check requirement in 2007, and was excluded from this analysis.
- Source: Everytown.
Universal criminal background check laws are making a difference.
- In 1994, 40% of U.S. gun owners who had recently acquired a firearm did so without a background check.
- In 2015, only 22% of gun owners who reported obtaining their most recent firearm within the previous 2 years reported doing so without a background check.
- However, in 2015, 50% of guns obtained from private sellers were still purchased without a background check. This percentage was 26% for owners residing in states regulating private firearm sales and 57% for those living in states without regulations on private firearm sales.
- Source: Firearm Acquisition Without Background Checks: Results of a National Survey. M. Miller, L. Hepburn, D. Azrael. Annals of Internal Medicine. First published in Annals.org on January 3, 2017.
- Missouri’s firearm-related murder rate increased 25% in the first three years and four months after the state repealed its background checks and purchase permit law. The law’s repeal was associated with an 18% increase in Missouri’s murder rates through 2013.
- Source: Johns Hopkins Center for Gun Policy and Research. “Effects of the Repeal of Missouri’s Handgun Purchaser Licensing Law on Homicides” by Daniel W. Webster, Cassandra Kercher Crifasi, and Jon S. Vernick. Journal of Urban Health 2014;91:293-302. Erratum: 2014; 91:598- 601.
- Support for comprehensive background checks is almost universal, 97 percent, including 97 percent among gun owners.
- Source: Quinnipiac University Poll, February 20, 2018.
- According to a 2017 Quinnipiac University poll, a huge majority of Americans support background checks before all gun sales: Democrats: 98%, Independents: 95%, Republicans: 93%
- Source: Quinnipiac University poll, June 2017.
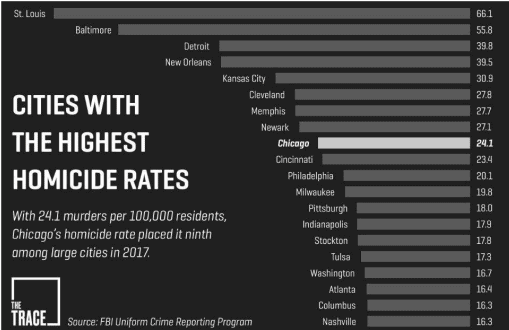
Cities' Gun Violence Rates
Chicago is often thought of as the gun violence capitol of America, but in 2017, the last year for which statistics are available,
Chicago’s homicide rate actually placed it ninth among large US Cities. St. Louis’ homicide rate is nearly 3 times higher than
Chicago’s.
- As of November 2019, violent crime in Minneapolis is down 3% compared to the previous five-year average, but the number of
shooting victims is up roughly 9% to 234. This is still down from the previous 5-year average of 241. About half of shootings happen in
Minneapolis’ 4th Precinct. - In St. Paul, shootings have increased to 147 so far in 2019, from 135 at the same time in 2018. Most other violent crimes have
decreased, with the exception of homicides, which are up 73%.- Source: “As crime rises in Minneapolis, observers wonder whether it’s part of a larger trend,” by Libor Jany, Star Tribune, November 8, 2019.
- Source: “As crime rises in Minneapolis, observers wonder whether it’s part of a larger trend,” by Libor Jany, Star Tribune, November 8, 2019.
Children, Youth and Guns
- Gun violence is the second leading cause of death of all children and youth in the United States.
- Source: “The Major Causes of Death in Children and Adolescents in the United States,” by Rebecca M. Cunningham, Maureen A. Walton, and Patrick M. Carter. New England Journal of Medicine, December 20, 2018.
- Gun violence is the leading cause of death for African-American males ages 15-34. It is the second leading cause of death for Latino males in the same age group.
- Sources: Centers for Disease Control and Prevention, “WISQARS: Fatal Injury Data.”
- From 1999 to 2009, among those aged 15 to 34 years, there were 106,271 homicides, 49% (52,265) among black men and 47,513 of those (91%) were due to firearms.
- Source: CDC WONDER online database. Compressed mortality file 1999- 2009 Series 20 No. 2O, 2012.
- According the Children’s Defense Fund, September 2019 report, in 2017,
- 3,410 children and teens died from guns—enough to fill 170 classrooms of 20 children.
- A child or teen was killed with a gun every 2 hours and 34 minutes.
- More children under five were killed by guns than law enforcement officers killed in the line of duty.
- Gun violence saturates our children’s lives and remains the second leading cause of death for all children and teens ages 1-19.
- Source: Children’s Defense.
- Toddlers with guns kill more Americans than foreign terrorists do.
- Source: 11/29/2015 08:46 am ET Updated Nov 25, 2016 “Toddlers Involved in More Shootings Than Terrorists in 2015” by Benjamin Powers.
- According to a study published in June 2017 in the Journal of Pediatrics, using data Centers for Disease Control and Prevention’s National Vital Statistics System database, and data on non-fatal gun injuries were from the U.S. Consumer Product Safety Commission’s National Electronic Injury Surveillance System:
- An average of 5,790 children in the United States receive emergency room treatment for gun-related injuries each year, and around 21% of those injuries are unintentional.
- An average of 1,297 children die annually from gun-related injuries, making guns the third-leading cause of death for children in America (behind illnesses and unintentional injuries like drownings or car crashes). The number is based on data taken from 2012–2014 for children up to the age of 17.
- 53% percent of the gun-related deaths were homicides, while 38% were suicides, 6% were unintentional and 3% were related to law enforcement or undetermined causes. Of the injuries, 71% were assault, 21% were unintentional, 5% were related to law enforcement or undetermined causes and around 3% were self-inflicted.
- In 2010, 91% of the children killed by guns around the world were American, where, according to the data, 19 children die from or are treated for gunshot wounds each day.
- Boys were responsible for 82% of gun-related deaths, and 84% of the injuries. While African-American children had the highest rate of homicide, white and Native American children had the highest rate of suicide.
- Though homicides among children declined between 2007 and 2014, suicides rose by 60%. The study found that about a third of the children who committed suicide had been depressed, while about a quarter had been clinically diagnosed with a mental health problem. Suicide was found to be more common in rural areas, with Idaho, Montana and Alaska leading the way.
- Source: Newsweek, “Kids and Guns: Shootings Now Third Leading Cause of Death for U.S. Children.” By Ryan Bort, June 19, 2017.
- From “Lock and Load”, an Op Ed by Nicholas Kristof, The NY Times, November 13, 2004, quoting David Hemenway, director of the Harvard Injury Control Research Center, in Private Guns, Public Health.
- In the 1990’s, two children a year, on average, died after locking themselves in car trunks. This was considered unacceptable, so a government agency studied the problem, and General Motors and Ford engineered safety mechanisms to prevent such deaths….We routinely make aspirin bottles childproof, but not guns, even though childproof pistols were sold back in the 19th century — they wouldn’t fire unless the shooter put pressure on the handle as well as the trigger.
- Source: NY Times.
- In the 1990’s, two children a year, on average, died after locking themselves in car trunks. This was considered unacceptable, so a government agency studied the problem, and General Motors and Ford engineered safety mechanisms to prevent such deaths….We routinely make aspirin bottles childproof, but not guns, even though childproof pistols were sold back in the 19th century — they wouldn’t fire unless the shooter put pressure on the handle as well as the trigger.
Costs of Gun Violence
- The direct cost of gun violence in Minnesota is $764 million per year. That includes healthcare costs ($32 million per year), law enforcement and criminal justice expenses ($31 million per year), employer costs ($4.5 million per year), and lost income ($696 million per year).
- Source: The Economic Cost of Gun Violence in Minnesota. Minnesota Coalition for Common Sense. Report published December 1, 2016 by Americans for Responsible Solutions.
- When the reduced quality of life attributable to pain and suffering ($1.4 billion) is considered, the estimate rises to $2.2 billion per year. This does NOT include significant, yet difficult-to-measure costs, like lost business opportunities, lowered property values, and reductions in the tax base.
- Source: The Economic Cost of Gun Violence in Minnesota. Minnesota Coalition for Common Sense. Report published December 1, 2016 by Americans for Responsible Solutions.
- Each gun death averages about $6 million in total costs. Each gun injury requiring hospitalization costs about $583,000.
- Source: Mother Jones, “What does gun violence really cost?” by Mark Follman, Julia Lurie, Jaeah Lee, and James West. April, 2005. Based on research by Ted Miller at the Pacific Institute for Research and Evaluation.
- Gun violence costs America $229 billion or $700 per American per year. That includes $6.8 billion in direct costs (police response, emergency services, medical care, court proceedings, imprisonment) and $221 billion (lost wages and quality of life).
- Source: Mother Jones, “What does gun violence really cost?” by Mark Follman, Julia Lurie, Jaeah Lee, and James West. April, 2005. Based on research by Ted Miller at the Pacific Institute for Research and Evaluation.
Data Collection and Research Prohibitions
- In 1996, Congress cut CDC funding by $2.6 million, the exact amount spent on gun research the previous year, then reappropriated the funds to different CDC projects and added this phrase into the CDC’s appropriations bill: “None of the funds made available for injury prevention and control at the Centers for Disease Control and Prevention may be used to advocate or promote gun control.”
- CDC funding for firearm injury prevention fell 96%, down to $100,000, from 1996 to 2013, according to Mayors Against Illegal Guns.
- Minnesota state law includes the following prohibition against the collection of data regarding guns: MN Statute 144.05: the commissioner of health is prohibited from collecting data on individuals regarding lawful firearm ownership in the state or data related to an individual’s right to carry a weapon under section 624.714.
- Source: Minnesota State Statute
Domestic Violence and Guns
- The presence of a gun in the home makes it 5 times more likely that a woman will be murdered by an abusive domestic partner.
- Source: J.C. Campbell, S.W. Webster, J.Koziol-McLain, et al., Risk factors for femicide within physically abuse intimate relationships: results from a multistate case control study, 93 Amer. J. of Public Health 1089-97 (2003).
- Women in the U.S. are 21 times more likely to be killed with a gun than women in other high-income countries, making this country the most dangerous in the developed world when it comes to gun violence against women. Source: Grinshteyn E, Hemenway D. Violent death rates in the US compared to those of the other high-income countries, 2015. Preventive Medicine. 2019; 123: 20-26
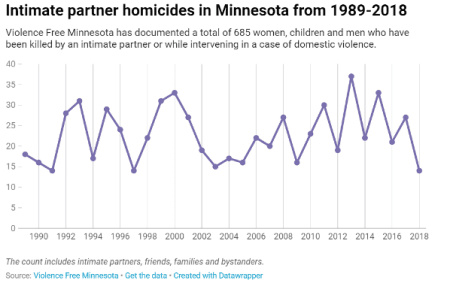
- Firearms are used in about 50% of the documented domestic violence homicides in Minnesota.
- Source: The 2016 Femicide Report, The Minnesota Coalition for Battered Women.
Extreme Risk Protective Orders – Gun Violence Protective Orders
- In 1999, Connecticut became the first state to pass a law granting law enforcement the clear legal authority to temporarily remove firearms from individuals when there is probable cause to believe they are at a significant risk of harm to self or others (called a risk-warrant). Indiana, California, and Washington have similar laws, though California and Washington also allow family members to petition for these orders.
- A 2016 public health study of Connecticut’s law found that in the first 14 years of Connecticut’s risk-warrant law (1999-2013):
- 762 risk-warrants were issued. Police removed an average of seven guns per subject.
- Typical risk-warrant subject was a middle-aged or older man – the same demographic that, nationwide, is most at risk for firearm suicide.
- Suicidality or self-injury was a listed concern in ≥61% of cases where such material was available.
- Before risk-warrant: Most risk-warrant subjects (88%) were not known to Connecticut’s public behavioral health system when the warrants were served – despite their elevated risk of self-harm.
- After risk-warrant: Nearly one-third (29%)7 of subjects received treatment in the state system.
- Significance: Risk-warrants provided a portal to critical mental health and substance abuse services.
- Conclusion: this analysis showed that risk-warrants:
- Reached individuals who were at a dangerously elevated risk of suicide.
- Prevented additional suicide deaths by intervening in crises — for every 10-20 risk warrants issued, one life was saved.
- Provided safe periods for subjects to obtain much-needed treatment services.
- Source: Swanson, JW, Norko, M, Lin, HJ, Alanis-Hirsch, K, Frisman, L, Baranoski, M, Easter, M, Gilbert, A, Swartz, M, & Bonnie, RJ. Implementation and Effectiveness of Connecticut’s Risk-Based Gun Removal Law: Does it Prevent Suicides? (August 24, 2016).
Guns and Crime
- 2017 study of the relationship between concealed carry laws and crime concluded that allowing citizens to carry handguns increases violent crime 13 to 15 percent by the 10th year of the laws being enacted in the state.
- Source: “Right-to-Carry Laws and Violent Crime: A Comprehensive Assessment Using Panel Data and a State-Level Synthetic Control Analysis” by John J. Donohue, Abhay Aneja, Kyle D. Weber, The National Bureau of Economic Research, orig published June 2017, Revised November 2018.
- A 2014 study examining the relationship between firearms and homicide rates on a state level found a significant positive relationship between gun ownership and overall homicide levels. Using 30 years of data, the study found that for every 1 percent increase in gun ownership, there was a 1.1 percent increase in the firearm homicide rate and a 0.7 percent increase in the total homicide rate.
- Source: “Examining the relationship between the prevalence of guns and homicide rates in the USA using a new and improved state-level gun ownership proxy”, Injury Prevention, April 2014.
Guns and Self-Defense
- According to a Harvard University analysis of data from the National Crime Victimization Survey, Americans defended themselves with a gun in less than 1 percent of crimes between 2007 to 2011. Moreover, using a gun in self-defense is not associated with a reduced risk of victim injury.
- Source: “The epidemiology of self-defense gun use: Evidence from the National Crime Victimization Surveys 2007–2011”, by David Hemenway and Sara J. Solnick, Preventive Medicine, October 2015.
Gun-Free Zones
- A study by Johns Hopkins, Stanford University and the University of Massachusetts Boston that reviewed every high-fatality rampage shooting from 1966-2015 found that 85% happened in places where guns were not banned. Just 12% happened in “gun-free zones.”
- Source: The Latest Research on Rampage Shootings Show that Gunmen Rarely Target Gun-Free Zones. Jennifer Mascia The Trace. November 30, 2016.
- According to a 2013 FBI study of 160 active shootings between 2000 and 2013, in only one incident was an armed civilian able to stop the attack–and that was a US Marine– but 21 of those shootings (13%) were interrupted by unarmed civilians. Thus, unarmed civilians are 20 times more likely to stop a rampage shooting than armed civilians.
- Source: The Latest Research on Rampage Shootings Show that Gunmen Rarely Target Gun-Free Zones. Jennifer Mascia The Trace. November 30, 2016
- “The overwhelming majority of people who commit mass shootings are suicidal at the time of their attacks: They fully intend to die, either by a self-inflicted gunshot wound or a shootout with police. The presence of armed guards is not a deterrent, it’s part of their plan. In fact, a significant subset of these offenders have specifically targeted government buildings and military facilities—places where armed opposition is all but certain.”
- Source: “For many mass shooters, armed guards aren’t a deterrent, they’re part of the fantasy”, by Christopher Ingraham, March 1, 2018, The Washington Post.
Danger of Guns in Homes
- Almost 45% of all households in Minnesota own at least one gun.
- Sources: 44.7% of Minnesota households own a gun. Centers for Disease Control and Prevention. (2015). National Centers for Injury Prevention and Control, Web-based Injury Statistics Query and Reporting System (WISQARS). Okoro, C. A., Nelson, D. E., Mercy, J. A., Balluz, L. S., Crosby, A. E., & Mokdad, A. H. (2002). Prevalence of household firearms and firearm-storage practices in the 50 states and the District of Columbia: Findings from the Behavioral Risk Factor Surveillance System, 2002. Pediatrics, 116(3), e370–e376.
- Guns in the home are 22 times more likely to be used to shoot a family member (accidental shootings, homicides and suicides) than for self-defense.
- Source: Kellermann, A. L., “Injuries and Deaths due to Firearms in the Home,” Journal of Trauma, 45:2 (1998):263-67.
- The presence of a gun in the home doubles the risk of homicide and triples the risk of suicide in the home.
- Source: “The Accessibility of Firearms and Risk for Suicide and Homicide Victimization Among Household Members: A Systematic Review and Metaanalysis”, by Andrew Anglemyer, Tara Horvath, George Rutherford, Annals of Internal Medicine, January 21, 2014.
- Women who live in a home with a gun are five times more likely to be murdered by their domestic partner.
- Source: J.C. Campbell, S.W. Webster, J.Koziol-McLain, et al., Risk factors for femicide within physically abuse intimate relationships: results from a multi- state case control study, 93 Amer. J. of Public Health 1089-97 (2003).
- Nationally, 31% of U.S. households contain a gun, and 50% of households don’t lock up their guns, including 40% of households with children.
- Source: 31% of U.S. households reported having a firearm in 2014. General Social Survey Final Report Trends in Gun Ownership in the United States, 1972-2014 March 2015 Presented By: NORC at the University of Chicago. The General Social Survey (GSS) is a project of the independent research organization NORC at the University of Chicago, with principal funding from the National Science Foundation.
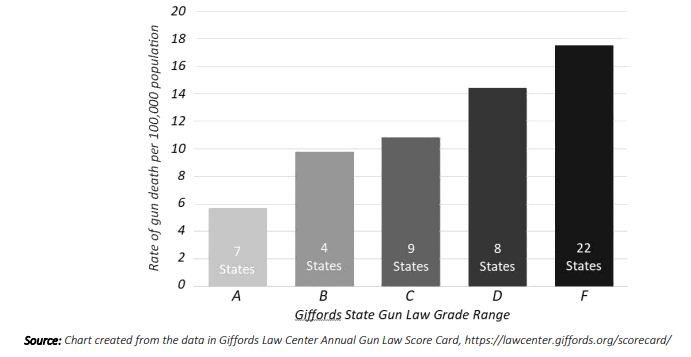
Effects of Gun Laws
- A 2018 study published in JAMA Internal Medicine found that strong state firearm policies were associated with lower suicide rates regardless of other states’ laws. Strong policies were associated with lower homicide rates, and strong interstate policies were also associated with lower homicide rates, where home state policies were permissive. Strengthening state firearm policies may prevent firearm suicide and homicide, with benefits that may extend beyond state lines.
- Source: JAMA, March 5, 2018, State Firearm Laws and Interstate Firearm Deaths From Homicide and Suicide in the United States: A Cross-sectional Analysis of Data by County Elinore J. Kaufman, MD, MSHP1; Christopher N. Morrison, PhD, MPH2; Charles C. Branas, PhD3; et al.
- A 2013 study from Boston Children’s Hospital, Harvard Medical School and Harvard School of Public Health found that states with the most laws regulating guns had a mortality rate 42% lower than those states with the fewest laws. The strong law states’ firearm-related homicide rate was 40% lower and their firearm-related suicide rate was 37% lower. Laws requiring universal background checks and permits to purchase firearms were most clearly associated with decreasing rates of gunrelated homicides and suicides.
- Source: Firearm Legislation and Firearm-Related Fatalities in the United States. Eric W. Fleegler, MD, MPH; Lois K. Lee, MD, MPH; Michael C. Monuteaux, ScD; David Hemenway, PhD; Rebekah Mannix, MD, MPH. JAMA Intern Med. 2013;173(9):732-740. doi:10.1001/jamainternmed.2013.1286.
- “The Assault weapons bans reduced the number of school shooting victims by 54.4 percent.” Mark Gius of Quinnipiac University writes in the journal Applied Economics Letters.
- Source: PS Mag 2017
- The rate of unintentional shootings has falling 48% since 1999. This can be attributed to the fact that 27 states now have child access prevention laws. While the improvement happened in every state, those with the most guns and the fewest laws continue to have the most accidental shooting deaths. Massachusetts, which has the lowest rate of unintentional deaths nationwide, is the only state to require that all firearms be locked up.
- Source: “Amid rising gun violence, accidental shooting deaths have plummeted. Why?”, by Kurtis Lee, Los Angeles Times, January 1, 2018
Gun Ownership
From Pew Survey, “Guns and Daily Life: Identity, Experiences, Activities and Involvement”; June 22, 2017.
- Gun ownership:
- 42% of Americans live in a household with a gun.
- 30% of Americans currently own a gun.
- 11% of Americans don’t own a gun but live with someone who does.
- 48% of Americans grew up in a household with guns.
- 59% of Americans say at least some of their friends own guns.
- 72% of Americans have shot a gun.
- Gun owners:
- 66% of gun owners own multiple firearms
- 73% say they could never see themselves not owning a gun.
- 74% of gun owners say the right to own a gun is essential, compared with only 35% of non-gun owners who say the same.
- Half of all gun owners say owning a gun is important to their overall identity – with 25% saying this is very important and another 25% calling it somewhat important.
- About half of white men (48%) say they own a gun. By comparison, about a quarter of white women and nonwhite men (24% each) own guns, along with 16% of nonwhite women.
- 46% of adults who live in rural areas say they own a gun. By comparison, 28% of adults who live in the suburbs and even fewer – 19% – in urban areas own a gun.
- Roughly half of all gun owners (49%) say that all or most of their friends own guns. In stark contrast, among those who don’t own a gun, only one-in-ten say that all or most of their friends own guns.
- Major reasons for gun ownership:
- 67% for protection
- 38% for hunting
- 30% for sport shooting
- 13% as part of a gun collection
- 8% for their job
- Reticence about gun ownership
- Eight-in-ten gun owners say they don’t mind if other people know they own a gun, but they don’t set out to tell them;
- 14% say they’d rather other people not know that they have a firearm
- 6% actively do want others to know
- Accessibility of guns
- 38% of gun owners say there is a gun that is both loaded and easily accessible to them all of the time when they’re at home. Men are especially likely to have a loaded gun at the ready: 43% of male gun owners vs. 29% of women who own guns say a loaded gun is always easily accessible.
- 72% of gun owners say they own a handgun or a pistol, while 62% say they own a rifle and 54% own a shotgun. Handguns are more common among those who own a gun for protection.
- Among those who own a handgun, about one-in-four (26%) say they carry their gun with them outside of their home all or most of the time, a share that rises to 41% among those who think of their local community as unsafe.
- Views on gun safety when children are in the home
- 95% of gun owners believe that talking to children about gun safety is essential, followed by
- 66% who say all guns should be kept in a locked place when there are children living in the home
- 59% who say gun owners who are parents should take a gun safety course.
- Majorities of non-gun owners also say these are essential measures for gun owners with children in the home.
- The majority of Americans who don’t own guns feel it is also essential for gun owners with children living in the home to keep their guns unloaded and in a separate spot from the ammunition. Gun owners disagree. Majorities say these measures are either important but not essential or not important, even in households with children.
- Roughly half of gun owners with children under 18 living at home say all of the guns in their home are kept in a locked place (54%) and all are unloaded (53%).
- 30% of gun owners say there is a gun that is both loaded and easily accessible to them all of the time when they’re at home.
- Source: Pew Research Center, “America’s Complex Relationship With Guns: An in-depth look at the attitudes and experiences of U.S. adults.” By Kim Parker, Juliana Menasce Horowitz, Ruth Igielnik, Baxter Oliphant, and Anna Brown. June 22, 2017.
- There are 5-8 hunters per square mile in Minnesota, which puts us in the second lowest hunter density region in the US. The Northeast has twice the number of hunters than any other region.
- Source: Quality Deer Management Association.
Gun Owners’ Views On Legislation
As reported by Americans for Responsible, “New Pew Research Provides Further Evidence that Gun Owners Support Solutions to Make Gun Laws Safer”, June 23, 2017.
- 80% of gun owners support requiring a background check on all gun sales, including those sold online or at gun shows, while just 16 percent oppose them.
- 86% of gun owners support prohibiting anyone convicted of stalking or domestic abuse from buying a gun.
- 85% of gun owners support prohibiting those on the federal terror watch list or no-fly lists from buying a gun.
- Gun owners overwhelming support requiring a permit to carry concealed. Nearly 9 out 10 gun owners, 88%, believe the requirement to have a permit to carry a concealed handgun in a public place should remain in place.
- By a 3 to 1 margin, gun owners do not want to deregulate the sale of silencers. Since the 1930s, the sale of silencers has been regulated the same way as machine guns and short-barreled rifles; to purchase a silencer buyers must have a clean criminal record and register the silencer with law enforcement. Nearly 3 out of 4 gun owners – 73% – support current law regarding the sale of silencers, while just 24 percent believe silencers should be deregulated.
- A majority of gun owners support gun-free school zones. By a 2 to 1 margin, gun owners support laws, like the GunFree School Zones Act, that prevent guns from being carried in K-12 schools.
- Gun owners are more likely to support politicians who support strong gun laws. 73% of gun owners are more likely to support a candidate who supports background checks for all gun purchases. 66% are more likely to support a candidate who supports gun violence prevention policies.
- The NRA is out of touch with gun owners on gun safety issues. 67% of the gun owners feel that the NRA used to be an organization dedicated to gun safety, but it’s been overtaken by lobbyists and the interests of gun manufacturers and lost its original purpose and mission. Less than 50% of gun owners feel that the organization represents their interests.
- Source: All points above come from a survey by Pew Research Center; “America’s Complex Relationship with Guns”, by Kim Parker, Juliana Menasce Horowitz, Ruth Igielnik, Baxter Oliphant, and Anna Brown; June 22, 2017.
Litigation: Protection of Lawful Action in Arms Act (PLCAA)
- In 2005, Congress passed the Protection of Lawful Commerce in Arms Act (PLCAA), and George W. Bush signed it into law. That law codified legally that the gun manufacturing industry could not be held liable in civil court for crimes “resulting from the criminal or unlawful misuse” of firearms or ammunition.
- There are almost no circumstances under which someone can sue a manufacturer in civil court for a crime committed with a gun. The PLCAA spells out only six exceptions. A manufacturer could be held liable if they knowingly sell a weapon to someone planning on committing a “crime of violence” or a “drug trafficking crime.” Similarly, a manufacturer or seller could be sued if they broke federal or state law in the process of selling or making their product if the manufacturer or seller’s action of breaking that law contributed substantially to the crime committed by the person with the gun.
- In all other circumstances, gun manufacturers have absolute immunity from litigation.
Mass Shootings
- A mass shooting–defined as a shooting incident that leaves four or more people dead or injured—takes place EVERY DAY in the United States.
- Source: The New York Times, “How Often Do Mass Shootings Occur?”, by Sharon Lafraniere, Sarah Cohen and Richard Oppel, Jr. December 2, 2015.
- Mass shootings are family affairs:
- 70% of mass shootings take place in the home.
- 57% of mass shootings involve either or partner or family member.
- 42% of mass shootings involve a current or former intimate partner.
- In 34% of mass shootings, the shooter was prohibited from possessing firearms.
- In 16% of mass shootings, the shooter was previously charged with domestic assault.
- Children are the most common victims of mass shootings. (19% adult men, 39% adult women, 42% children 17 and under).
- Source: Jeltsen, Melissa. We’re Missing the Big Picture on Mass Shootings. (August 25, 2015). The Huffington Post.
- Almost one half of mass shootings are related to domestic violence.
- Source: Jeltsen, Melissa, Almost A Third of Mass Shooting Deaths in 2015 Were Related to Domestic Violence (May 23, 2016). The Huffington Post.
- Fewer than 100 of the 30,000 annual gun deaths in the United States happen in mass shootings (those with four or more victims killed in a single incident not involving gangs or drugs). That’s 0.3%.
- Source: Luca, Michael and Malhotra, Deepak K. and Poliquin, Christopher, The Impact of Mass Shootings on Gun Policy (May 4, 2016). Harvard Business School NOM Unit Working Paper No. 16-126.
- More than 20,400 pieces of gun-related legislation have been proposed following mass shooting events from 1990 to 2014. Of those bills, more than 3,000 have become law, primarily at the state level.
- Source: Luca, Michael and Malhotra, Deepak K. and Poliquin, Christopher, The Impact of Mass Shootings on Gun Policy (May 4, 2016). Harvard Business School NOM Unit Working Paper No. 16-126. Page 6.
- Mass shootings are expensive. Each of the six deaths in the mass shooting targeting Rep. Gabby Gifford’s cost about $7 million.
- Source: NPR.
The most deadly mass shootings in the US in modern history:
Date | Location | Killed and Wounded |
|---|---|---|
October 1, 2017 | Mandalay Bay Resort, Las Vegas, NV | 58 killed, more than 850 wounded |
June 12, 2016 | Pulse Nightclub, Orlando, FL | 50 killed, 53 wounded |
April 16, 2007 | Virginia Tech, Blacksburg, VA | 32 killed, 17 wounded |
November 5, 2017 | Sutherland Springs, TX | 26 killed, 20 wounded |
December 14, 2012 | Sandy Hook, Newtown, CT | 26 killed (20 children, 6 adults), 2 wounded |
October 16, 1991 | Killeen, TX | 23 killed, 27 wounded |
August 3, 2019 | El Paso, TX, Walmart | 22 killed, 24 wounded |
July 18, 1984 | San Ysidro, CA | 20 adults and children killed, 16 wounded |
February 14, 2018 | Stoneman Douglas HS, Parkland, FL | 17 killed, 17 wounded |
August 1, 1966 | U of TX bell tower, Austin, TX | 15 killed, 31 wounded |
December 2, 2015 | Inland Regional Cntr, San Bernardino, CA | 14 killed, 22 wounded |
August 20, 1986 | Post Office, Edmond, OK | 14 killed, 6 wounded |
November 5, 2009 | Fort Hood, TX | 13 killed, 30 wounded |
April 20, 1999 | Columbine HS, Aurora, CO | 13 killed, 24 wounded |
November 7, 2018 | Thousand Oaks, CO | 13 killed, 18 wounded |
May 31, 2019 | Virginia Beach, VA | 12 killed, 4 wounded |
October 27, 2018 | Tree of Life Synagogue, Pittsburgh, PA | 11 killed, 6 wounded |
May 18, 2018 | Santa Fe High School, TX | 10 killed, 13 wounded |
August 4, 2019 | Dayton, OH | 9 killed, 27 wounded |
Source: “18 of the deadliest mass shootings in US history”, by Mark Abadi and James Pasley, Business Insider, August 5, 2019.
Mental Illness and Gun Violence
- The impact of mental illness on gun violence statistics amounts to about 4% of all firearm homicides.
- Source: Gun violence not a mental health issue, experts say, pointing to ‘anger,’ suicides. CNN. Emanuella Ginsberg. January 25, 2016. Quoting February 2015, Vol 105, No. 2 | American Journal of Public Health Metzl and MacLeish | Peer Reviewed | Framing Health Matters | 243
- The vast majority of people diagnosed with psychiatric disorders do not commit violent acts—only about 4% of violence in the United States can be attributed to people diagnosed with mental illness.
- Source: Fazel S, Grann M. The population impact of severe mental illness on violent crime. Am J Psychiatry. 2006; 163(8):1397—1403. 42. Friedman R. A misguided focus on mental illness in gun control debate. New York Times. December 17, 2012: Health. Accessed July 23, 2014.
- The American Psychiatric Association recommends firearms restriction based on “evidence of dangerousness”, as opposed to psychiatric diagnosis.
- Source: Gun violence not a mental health issue, experts say, pointing to ‘anger,’ suicides. CNN. Emanuella Ginsberg. January 25, 2016.
Minnesota Gun Deaths
- In 2017, the most recent year for which data is available from the Minnesota Department of Health:
- More than 3 people are shot per day in Minnesota, and more than one dies from their injuries.
- 1234 Minnesotans were shot in 2017; 465 died.
- Between 2000 and 2017, deaths from firearms increased 50% in Minnesota. During the same period, gun deaths increased 38% nationally. • Youth and young adults between the ages of 15-25 made up the largest percentage of gun deaths in 2017; both gun suicide and gun homicide peaked in that age range. There was another peak in gun suicides in the 56-60 age range.
- Again in 2017, more Minnesotans died from gun violence than either motor vehicle accidents or opioids.
- 358 Minnesotans died in motor vehicle accidents1
- 401 Minnesotans died from opioids2
- 465 Minnesotans died from firearms3
- Sources: dps.mn.gov Crash Facts 20171. “Minnesota’s Corporate Leaders Join Fight Against Opioids”, Star Tribune, September 18, 20182. Minnesota Department of Health 2017 gun death statistics3.
- 365 Minnesotans died by gun suicide — one every day.
- Gun suicides increased 65% between 2000-2017 in Minnesota while gun homicides increased less than 3% during the same time span.
- The average gun suicide victim in Minnesota is a white male who lives in a rural area.
- 79% of all gun deaths in Minnesota were suicides.
- Males accounted for 75% of all gun suicides
- Females accounted for 6% of all gun suicides
- Gun suicides peaked between the ages of 15-25 in 2017. There was another peak between ages 50-60.
- Source: Minnesota Department of Health, as received from the Centers of Disease Control and Prevention.
- Suicide is now the second leading cause of death for youth ages 10-24 in Minnesota. In the rest of the country suicide is the third leading cause of child death, so proportionately more of our kids are killing themselves.
- Source: Minnesota Department of Health. Injury and Violence Prevention Unit. September 2013.
- From 2014 through 2018, there were 18 mass shootings in Minnesota. A total of 13 people were killed and 76 were injured.
- Source: Gun Violence Archive, “Past Summary Ledgers,” (last accessed June 2019). Mass shootings are defined as incidents where four or more people are shot or killed, not including the perpetrator.
Minnesota State Gun Law - Synopsis
- Minnesota:
- Makes it a crime for an unlicensed person to transfer a firearm without a background check under certain very limited circumstances;
- Imposes child access prevention requirements upon gun owners;
- Prohibits firearm possession by certain misdemeanants and domestic abusers;
- Requires individuals purchasing certain kinds of firearms from a licensed dealer to undergo a background check in addition to the federally required background check, and either comply with a waiting period or obtain a permit;
- Regulates unsafe handguns;
- Imposes either a five-day or a seven-day waiting period (the law is unclear) on transfers of handguns and assault weapons by federally licensed dealers from the day the dealer delivers a transfer report to the police chief or sheriff (does not apply to private sellers);
- Provides some regulation of the possession and sale of certain “semiautomatic military-style assault weapons,” although the state does not generally ban assault weapons.
- Prohibits Commissioner of Health and state agencies from collecting data regarding guns and gun ownership.
- Minnesota does not, however:
- Require a background check prior to most transfers of firearms between unlicensed parties;
- Require firearm owners to obtain a license, register their firearms, or report lost or stolen firearms;
- Restrict 50 caliber rifles or large capacity ammunition magazines;
- Limit the number of firearms that may be purchased at one time;
- Require that guns be safely secured with trigger locks or by locking them up unloaded.
- Local governments in Minnesota lack authority to regulate firearms or ammunition, known as “preemption”: MN Statute 471.633 preempts local regulation of firearms, except regulations relating to the discharge of a firearm. Another section expressly allows local zoning of firearms shops.
- Minnesota generally requires county sheriffs to issue a permit to carry a handgun to any applicant who meets certain basic qualifications. (County sheriffs “shall” not “may” issue a permit to carry.)
- Source: Law Center to Prevent Gun Violence.
Minnesota Views on Gun Control
- According to a Star Tribune poll published October 22, 2019, a large majority of Minnesotans support universal criminal background checks:
- 84% of all Minnesotans; 88% in Hennepin and Ramsey Counties; 81% or higher in metro suburbs and rural MN.
- 97% of Democrats; 75% of Republicans; 77% of Independents/other respondents.
- 82% or more of all age groups.
- 87% of women; 81% of men
- A slight majority of Minnesotans support a ban on military-styled rifles:
- 58% of all Minnesotans supported a ban, while 36% were opposed and 6% were undecided.
- 65% supported a ban in Hennepin and Ramsey County; 59% supported a ban in southern Minnesota.
- More than half supported a ban in the metro suburbs and northern Minnesota.
- 63% of women supported a ban compared to 52% of men.
- 68% of 18-34 year olds supported a ban; 59% of voters 65 and older supported a ban.
- The poll also found that most Minnesota voters would support creating a national database “accessible to local law enforcement that would track all gun sales in the United States.” Nearly 7 in 10 Minnesota voters backed the idea, including 9 out of 10 Democrats, 65% of Independents and 49% of Republicans.
- Source: “Minnesota Poll: Support remains high for universal background checks,” by Stephen Montemayor, Star Tribune, October 22, 2019.
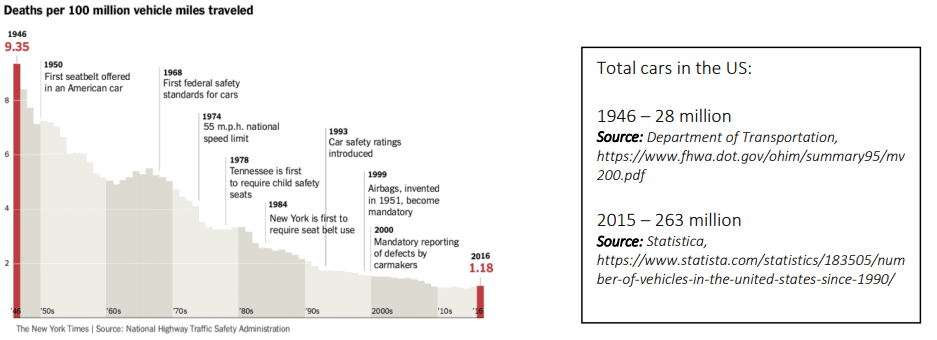
Motor Vehicle Fatalities – Analogy
National Rifle Association (NRA)
- Membership in Perspective
- Total US population 327.5 million in 2017
Source: US Census Bureau. - Total gun owners 97 million
Source: Calculated, based on 30% ownership, as reported in the Pew Research Center Survey, “Guns and Daily Life: Identity, Experiences, Activities and Involvement”; June 22, 2017. - Total hunters 16.9 million
Source: (In 2017) The Statistics Portal. - NRA membership “nearly” 5 million
Source: The NRA website. - Analysis The NRA represents just 1.5% of all Americans. More than 70% of hunters do not belong to the NRA. 95% of gun owners do not belong to the NRA.
- Total US population 327.5 million in 2017
- NRA Budget
- “In many accounts, the power of the N.R.A. comes down to money. The organization has an annual operating budget of some quarter of a billion dollars, and between 2000 and 2010 it spent fifteen times as much on campaign contributions as guncontrol advocates did.”
- Source: The New Yorker, October 19, 2015, “Taking on the N.R.A.” by James Surowiecki.
- “In many accounts, the power of the N.R.A. comes down to money. The organization has an annual operating budget of some quarter of a billion dollars, and between 2000 and 2010 it spent fifteen times as much on campaign contributions as guncontrol advocates did.”
- Total 2016 Expenditures
- The National Rifle Association spent $419 million in 2016, increasing its 2015 total by over $100 million.
- Source: The Huffington Post, “NRA Spending Approached Half A Billion Dollars in 2016,” by Nick Wing, November 16, 2017.
- The National Rifle Association spent $419 million in 2016, increasing its 2015 total by over $100 million.
NRA Expenditures 2016 Election
Donald Trump | $30.3 million | won |
Richard Burr, NC | $6.3 million | won |
Marco Rubio, FL | $3.2 million | won |
Roy Blunt, MO | $3.0 million | won |
Todd Young, IN | $2.8 million | won |
Joe Heck, NV | $2.5 million | lost |
Rob Portman, OH | $2.2 million | won |
Total: $50.3 million
Source: OpenSecrets.org; Nov. 9, 2016.
Predictors of Gun Violence
- Maleness
- Men represent more than 90 percent of the perpetrators of homicide in the United States and are also the victims of the large majority (78 percent) of that violence.
- Source: Bureau of Justice Statistics, 2008; Federal Bureau of Investigation [FBI], 2007. As reported in “Gun Violence: Prediction, Prevention and Policy,” American Psychiatric Association, by Eric Mankowski.
- Males complete the large majority of suicides. Depending on the age group, four to six times as many males as females kill themselves with firearms.
- Source: CDC, 2013a. As reported in “Gun Violence: Prediction, Prevention and Policy,” American Psychiatric Association, by Eric Mankowski.
- Men represent more than 90 percent of the perpetrators of homicide in the United States and are also the victims of the large majority (78 percent) of that violence.
- Alcohol Abuse
- Gun owners who have been convicted of an alcohol-related offense, such as driving under the influence or drunk and disorderly conduct, are up to five times as likely to be arrested for a violent or firearm-related crime than those who have not.
- A conviction for a crime involving alcohol is a much greater indication of future violent behavior than a conviction for almost any other offense — including other violent ones.
- The study showed “Alcohol was a more important predictor of future violence than prior violence was.”
- Source: Study conducted by the Violence Prevention Research Program at UC-Davis, “Firearms, alcohol and crime: convictions for driving under the influence (DUI) and other alcohol-related crimes and risk for future criminal activity among authorised purchasers of handguns”, Garen J Wintemute, Mona A Wright, Alvaro Castillo-Carniglia, Aaron Shev, Magdalena Cerdá. As reported by The Trace, February 2, 2017, by Kate Masters.
- One study showed that 34 percent of gun homicide perpetrators had been drinking before they killed someone.
- Acute and chronic alcohol misuse is positively associated with firearm ownership, risk behaviors involving firearms, and risk for perpetrating both interpersonal and self-directed firearm violence.
- In an average month, an estimated 8.9 to 11.7 million firearm owners binge drink.
- For men, deaths from alcohol-related firearm violence equal those from alcohol-related motor vehicle crashes.
- Enforceable policies restricting access to firearms for persons who misuse alcohol are uncommon. Policies that restrict access on the basis of other risk factors have been shown to reduce risk for subsequent violence.
- Source: ”Alcohol misuse, firearm violence perpetration, and public policy in the United States.” University of California, Davis, April 30, 2015.
- Past Violence Acts
- Between 80 and 90 percent of murderers have prior police records in contrast to 15 percent of American adults overall.
- Domestic murders are preceded by prior domestic violence more than 90 percent of the time, and 46 percent of domestic murderers have had a restraining order against them in the past.
- The probability of violence increases in a linear pattern with the number of past violent acts.
- Source: “Can We Have Compassion for the Angry?” by Laura Hayes, Slate, June 26, 2016.
- Anger
- There is a profile of the typical mass murderer: He is male, white, and single, divorced, or separated. He is also isolated, lacking in social support, and bears a grudge toward someone or something. He externalizes blame and sees himself as wronged. It is clear the first part of this profile—male, white, and single—is not the part that would best predict a violent killer. It is the second part,—lonely and isolated, blaming others for his problems, and most importantly, angry—that depicts a man likely to lose control.
- Source: “Can We Have Compassion for the Angry?” by Laura Hayes, Slate, June 26, 2016.
- There is a profile of the typical mass murderer: He is male, white, and single, divorced, or separated. He is also isolated, lacking in social support, and bears a grudge toward someone or something. He externalizes blame and sees himself as wronged. It is clear the first part of this profile—male, white, and single—is not the part that would best predict a violent killer. It is the second part,—lonely and isolated, blaming others for his problems, and most importantly, angry—that depicts a man likely to lose control.
- Trauma
- Evidence shows that when children are exposed to weapons-related violence, their mental health suffers and they are significantly more likely to commit violent crimes.
- “Based on this study’s results, showing the importance of personal contact with violence, the best model for violence may be that of a socially infectious disease,” says Felton Earls, MD, HMS professor of social medicine and principal investigator of the study.
- Source: “Witnessing gun violence significantly increases the likelihood that a child will also commit violent crimes.” Harvard Gazette, May 26, 2005
- Mental Illness
- Only 3% to 5% of US crimes involve people with mental illness, and the percentages of crimes that involve guns are lower than the national average for persons not diagnosed with mental illness.
- Source: Appelbaum PS. Violence and mental disorders: data and public policy. Am J Psychiatry. 2006;163(8):1319—1321
- Only 3% to 5% of US crimes involve people with mental illness, and the percentages of crimes that involve guns are lower than the national average for persons not diagnosed with mental illness.
Race and Racism
- The gun epidemic is the leading cause of death of young African-American men, more than the next nine causes put together.
- Source: Politifact.
- Nationally, black Americans account for 55% of gun homicide victims but make up just 13% of the population. Black men account for nearly half of all gun homicide victims, but make up just 6% of the population.
- Source: Pew Research Center. “Blacks Suffer Disproportionate Share of Firearm Homicide Deaths.” May 21, 2013.
- Black men are 14 times more likely than non-Hispanic white men to be shot and killed with guns.
- Source: “Fatal Injury Reports,” Injury Prevention & Control: Data & Statistics (WISQARS), accessed January 25, 2015.
- According to the Washington Post, African Americans are killed by police at a rate 2-1/2 times greater than whites.
- Source: Wesley Lowery, the Washington Post. “Aren’t more white people than black people killed by police? Yes, but no.” July 11, 2016.
- Between 1980-2014, 67% of the teenagers and 66% of the kids under 14 who were killed by police were African American. Between 2010 and 2012 alone, police officers shot and killed 15 teens running away from them; all but one of them black.
- Source: Thompson, Heather Ann. Inner-City Violence in the Age of Mass Incarceration. The Atlantic. (October 30, 2014).
- According to the FBI’s most recent statistics, 84% of white murder victims are killed by white people, compared to 90% of black murder victims who are killed by black people.
- Source: FBI. 2014 Crime in the United States report.
- Whites are six times more likely to be murdered by another white person as by a black person.
- Source: FBI. 2014 Crime in the United States report.
School Shootings and Arming Teachers
- There were at least 208 school shootings in the US between Columbine in 1999 and Parkland in 2018.
- Source: Parkland School Shooting 208th Since Columbine: The Tragic List. In Westword. By Michael Roberts, February 15, 2018.
- Since the Columbine High shooting in 1999, more than 208,000 American children have experienced shootings at 212 schools. That is significantly more than the populations of the Rochester and Duluth combined.
- Sources: “More than 208,000 students have experienced gun violence at school since Columbine,” by John Woodrow Cox, Steven Rich, Allyson Chiu, John Muyskens and Monica Ulmanu, The Washington Post, April 21, 2018. Minnesota city population from Minnesota Cities by Population, with data provided by US Census.
- At least 131 children, educators and other people have been killed in school shootings since Columbine, and another 272 have been injured.
- Sources: “More than 208,000 students have experienced gun violence at school since Columbine,” by John Woodrow Cox, Steven Rich, Allyson Chiu, John Muyskens and Monica Ulmanu, The Washington Post, April 21, 2018.
- “The Assault weapons bans reduced the number of school shooting victims by 54.4 percent.” Mark Gius of Quinnipiac University writes in the journal Applied Economics Letters.
- Source: PS Mag.
- Would arming teachers help prevent school shootings?
- Christopher Ingraham at the Washington Post looked at how many gun homicides, suicides, and accidental shootings there were in comparison to “justifiable” homicides (“the killing of a felon, during the commission of a felony, by a private citizen”), based on the FBI’s 2012 data. His findings: For every justifiable gun homicide, there were 34 criminal gun homicides, 78 gun suicides, and two accidental gun deaths.
- Data on mass shootings tells a similar story: According to the FBI’s report on active shooter events between 2000 and 2013, only about 3 percent were stopped by a civilian with a gun. Unarmed civilians actually stopped more incidents — about 13 percent. Most of the incidents — more than 56 percent — ended on the shooter’s initiative, when the shooter either killed himself or herself, simply stopped shooting, or fled the scene.
- Why guns in school make us less safe
- Teachers will now become the first targets of shooters since they will be expected to be the ones who could fight back.
- Teachers will be ineffective at neutralizing the shooter. Even highly trained police officers only hit their intended targets between 30 and 35 percent of the time, according to analysis by The New York Times.
- Stray bullets from these misses are likely to injure or kill their own students and colleagues.
- Teachers with guns will now become the targets of police when they arrive on campus and do not know who the active shooter is in the chaos.
- Teachers may feel compelled to leave their classrooms where they are keeping children calm and quiet to confront the shooter. These young children are more likely to panic and make noises that makes them an easier target for the shooter.
- Teachers experiencing personal issues or a mental breakdown now have a weapon more readily at their disposal that can be easily accessed and used against themselves or their students and colleagues.
- Source: Your Turn: Why arming public-school teachers like me is such a bad idea, by Jeff Taylor, opinion contributor Published 6:23 a.m. MT March 2, 2018.
Second Amendment
- A well regulated Militia, being necessary to the security of a free State, the right of the people to keep and bear Arms, shall not be infringed.
- The 2008 Heller decision expanded the scope of constitutional protection to the possession of firearms for the purpose of personal self-defense, despite the fact that amendment’s opening language clearly says that gun ownership was specifically preserved by the founding fathers in the interest of the common defense against a tyrannical government. But Heller also stated clearly that government has the right to regulate WHO can possess a firearm, WHERE and HOW firearms may be carried, WHICH firearms may be sold and by WHOM.
- On pp. 54 and 55, the majority opinion, written by conservative bastion Justice Antonin Scalia, states: “Like most rights, the right secured by the Second Amendment is not unlimited…”. It is “…not a right to keep and carry any weapon whatsoever in any manner whatsoever and for whatever purpose.”
- “Nothing in our opinion should be taken to cast doubt on longstanding prohibitions on the possession of firearms by felons and the mentally ill, or laws forbidding the carrying of firearms in sensitive places such as schools and government buildings, or laws imposing conditions and qualifications on the commercial sale of arms.”
- “We also recognize another important limitation on the right to keep and carry arms. Miller (an earlier case) said, as we have explained, that the sorts of weapons protected were those “in common use at the time”. We think that limitation is fairly supported by the historical tradition of prohibiting the carrying of ‘dangerous and unusual weapons.’ ”
- The court even recognizes a long-standing judicial precedent “…to consider… prohibitions on carrying concealed weapons.”
Stand Your Ground Laws
A majority of states (35) now have some form of Stand Your Ground law.
- What the studies have found:
- The most consistent finding of academic studies is that Stand Your Ground laws increase homicides but have no deterrence effect on crime.
- Stand Your Ground laws exacerbate racial discrepancies in whether a homicide is considered justifiable.
- Most defendants in Stand Your Ground cases had previous criminal records, and many had been previously accused of violent crimes.
- Most defendants could have safely retreated from the conflict without utilizing lethal force.
- Source: GVPedia White Paper: Stand Your Ground Laws, by GVP Admin, July 26, 2018
- Guns are rarely used to kill criminals or stop crimes. Between 2009-2013, for every ONE use of a gun in justifiable homicide for self-defense, there were 37 uses of guns in criminal homicides.
- Source: Violence Policy Center, 2016
- The implementation of Florida’s Stand Your Ground law was associated with a 24.4% increase in homicide and a 31.6% increase in firearm-related homicide.
- Source: JAMA, 2017
- On average, Stand Your Ground states have experienced a 53% increase in homicides deemed legally “justifiable” in the years following passage of the law, compared to a 5% decrease in states without Stand Your Ground laws.
- Source: National Urban League, 2013
Stolen Guns
- From 2012 through 2018, close to 407 firearms were stolen from gun dealers in Minnesota.
- Source: Center for American Progress analysis of U.S. Bureau of Alcohol, Tobacco, Firearms and Explosives, “Data and Statistics: Federal Firearms Licensee Statistics Theft / Loss Reports,” (last accessed June 2019). The authors did not include lost firearms in this analysis.
- Overall, an estimated 11,597 firearms were stolen in Minnesota from both individual gun owners and gun dealers from 2012 through 2017.
- Source: Center for American Progress analysis of Inter-university Consortium for Political and Social Research, “Uniform Crime Reporting (UCR) Program Data: Property Stolen and Recovered (Supplement to Return A) 1960–2017”.
- According to FBI data, during the four-year period from 2012 to 2015,
- an estimated 1.2 million guns – nearly half a billion dollars’ worth – were stolen from individuals nationwide.
- 22,000 guns were stolen from gun stores during this same period.
- A gun is stolen in the U.S. every two minutes.
- Between 2012 and 2016, burglaries of licensed gun dealers increased 48%, and robberies of licensed gun dealers increased 175 percent.
- Source: “Stolen Guns in America: A State-by-State Analysis”, by Chelsea Parsons and Eugenio Weigend Vargas, Center for American Progress, July 25, 2017.
- Estimates from a number of survey studies indicate that roughly 200,000 to 400,000 guns are stolen from individuals each year. The most recent study by researchers at the Harvard T.H. Chan School of Public Health and the Northeastern University Department of Health Sciences found that approximately 380,000 firearms are stolen from gun owners each year, two-thirds of which are stolen in the southern region of the United States.
- Source: “Stolen Guns in America: A State-by-State Analysis”, by Chelsea Parsons and Eugenio Weigend Vargas, Center for American Progress, July 25, 2017.
- ATF can do little more than offer voluntary suggestions to improve security at gun stores. Although ATF is the federal agency charged with licensing and regulating the gun industry, including licensed gun dealers, it does not have the authority to mandate that dealers implement any specific security measures designed to prevent theft.
- Source: “Stolen Guns in America: A State-by-State Analysis”, by Chelsea Parsons and Eugenio Weigend Vargas, Center for American Progress, July 25, 2017.
- The lack of mandatory reporting of stolen guns enables gun trafficking and straw purchasing by eliminating accountability and allowing individuals whose guns end up used in connection with crime to simply say that the guns were stolen. Congress and state legislatures should enact laws requiring all gun owners to promptly report stolen or lost guns to law enforcement. A June 2016 poll commissioned by The New York Times found that 88 percent of voters support this policy.
- Source: “Stolen Guns in America: A State-by-State Analysis”, by Chelsea Parsons and Eugenio Weigend Vargas, Center for American Progress, July 25, 2017.
Suicide by Gun
- A person living in a home with a gun is three times more likely to commit suicide than someone who does not.
- Source: The Accessibility of Firearms and Risk for Suicide and Homicide Victimization Among Household Members: A Systematic Review and Meta-analysis. Andrew Anglemyer, PhD, MPH; Tara Horvath, MA; and George Rutherford, MD. Annals of Internal Medicine. Vol. 160, No.2, Jan. 21, 2014.
- Firearms have the highest lethality of any means of suicide.
- Firearms – 82.5% fatality rate
- Drowning/submersion – 65.9%
- Suffocation/hanging – 61.4%
- Poison by gas – 41.5%
- Jumping from height – 34.5%
- Drug/poison ingestion – 1.5%
- Cutting/piercing – 1.2%
- Other – 8.0%
- Source: Spicer, R.S. and Miller, T.R. Suicide acts in 8 states: incidence and case fatality rates by demographics and method. American Journal of Public Health. 2000:90(12);1885
- In 2017, 365 Minnesotans died by gun suicide—one every day. Gun suicides increased 65% between 2000-2017 in Minnesota while gun homicides increased less than 3% during the same time span.
- Source: Minnesota Department of Health.
- Nationally, deaths by suicide have increased by around 30% since 1999, claiming nearly 45,000 lives in 2016, according to the report. Those trends apply to nearly every segment of the U.S. population: Suicide rates have increased in 44 states, among all racial and ethnic groups and in every age range except adults older than 75. In half of all states, suicide rates increased by 30% or more.
- Source: CDC, “Suicide Rising Across the US.” June, 2018.
- According to the CDC, suicide is now the third-leading cause of death for Blacks ages 15-24. Although white people have the highest suicide rates in the country, the numbers around Black boys age 5-11 have doubled over the past 20 years. Researchers using this data have concluded that part of this rise is due to Black children “likely to be exposed to violence and traumatic stress, and that black children are more likely to experience an early onset of puberty, which can increase the risk of depression and impulsive aggression.”
- Source: Black, young and suicidal: An epidemic we must continue to bring to light. By TheGrio – August 28, 2017
- The rate of firearm suicide is 66% higher in rural counties than in metropolitan areas. Non-firearm suicide rates in rural and urban communities are roughly the same.
- Source: Guns Play Oversize Role in Rural Suicides. By Nicholas Bakalar. New York Times, August 17, 2017.
- Men account for 80% of all suicides, and 90% of gun suicides.
- Source: Guns Play Oversize Role in Rural Suicides. By Nicholas Bakalar. New York Times, August 17, 2017.
- Time elapsed between decision to commit suicide and suicide attempt:
- Less than 5 minutes = 24%
- Less than 20 minutes = 48%
- Within an hour = 71%
- Most gun suicides occur in the first month after gun purchase.
- 90% of people who survive suicide attempts don’t go on to kill themselves.
- Source: 10 Essential Facts about Guns and Suicide. Kerry Shaw. The Trace. September 6, 2016.
Terrorism
- Between 9/11/2001 and 12/31/2016, 3,222 Americans were killed in terrorist attacks at home and abroad, including perpetrators and excluding deaths in Afghanistan and Iraq.
- 3,081 of these deaths occurred on American soil.
- 2,902 of these deaths occurred during the attacks on September 11, 2001.
- During the same time span, over 512,000 Americans were killed by guns.
- Sources: “Fact Sheet”, National Consortium for the Study of Terrorism and Responses to Terrorism, © University of Maryland, November 2017. Also, gun deaths facts from the CDC, as reported in TIME, “Gun-Related Deaths in America Keep Going Up,” by Maya Rhodan, November 6, 2017. Also, Centers for Disease Control, for gun deaths data.
Unintentional Shootings
- From the Los Angeles Times:
- There were 489 people killed in unintentional shootings in the US in 2015, the most recent year for which data are available.
- That was down sharply from 824 deaths in 1999, according to the CDC. Taking into account population growth over that time, the rate of unintentional shootings fell 48%. This can be attributed to the fact that 27 states now have child access prevention laws. While the improvement happened in every state, those with the most guns and the fewest laws continue to have the most accidental shooting deaths.
- Massachusetts, which has the lowest rate of unintentional deaths nationwide, is the only state to require that all firearms be locked up.
- Of the 489 people killed in accidental shootings in 2015, more than 85% were male, and nearly 27% of those were 15 to 24. The rate for that group was more than triple the national average. Men between 25 and 34 were the next most vulnerable.
- Source: “Amid rising gun violence, accidental shooting deaths have plummeted. Why?”, by Kurtis Lee, Los Angeles Times, January 1, 2018.
- The gun lobby has introduced legislation in 13 states, including Minnesota in 2011, to gag doctors and prevent them from asking parents about gun storage. So far these laws have passed only in Florida.
- Source: Everytown for Gun Safety.
Urban Gun Violence
Urban gun violence is defined by neighborhood boundaries, as illustrated by these data comparing murder rates per 100,000 residents in safest and least safe neighborhoods:
| City | Safest Neighborhood | Least Safe Neighborhood |
| Milwaukee | 12 | 33.75 |
| Chicago | 3.54 | 32.69 |
| New York | 1.5 | 7.2 |
Source: Hertz, Daniel Kay. The Debate Over Crime Rates is Ignoring the Metric that Matters Most: ‘Murder Inequality’. The Trace. (July 25, 2016).
- Gun violence follows an epidemic-like process of social contagion that is transmitted through networks of people by social interactions. Violence prevention efforts that account for social contagion, in addition to demographics, have the potential to prevent more shootings than efforts that focus on only demographics.
- Source: Modeling contagion through social networks to explain and predict gunshot violence in Chicago, 2006 to 2014. Ben Green, MSc; Thibaut Horel, MSc; Andrew V. Papachristos, PhD. JAMA Internal Med. January 3, 2017,
- Multiple recent reports on urban gun violence specifically have shown that strong gun laws, when combined with sustained community investment and effective law enforcement, can significantly decrease entrenched urban gun violence.
- Source: Firearm Legislation and Firearm-Related Fatalities in the United States, Ben Green, MSc; Thibaut Horel, MSc; Andrew V. Papachristos, PhD; Eric W. Fleegler, MD, MPH; Lois K. Lee, MD, MPH; Michael C. Monuteaux, ScD; David Hemenway, PhD; Rebekah Mannix, MD, MPH. JAMA Intern Med. 2013;173(9):732-740. doi:10.1001/jamainternmed.2013.1286.
This data was compiled and authenticated by researchers at Protect Minnesota. Protect Minnesota is an independent, statebased organization that promotes the health and safety of all Minnesotans by preventing gun violence through effective legislation, policies and community education.